Table of Contents
How to Effectively Export Crystal Reports to Excel and Word
Standard Crystal Reports exports often result in static data, but advanced tools like R-Tag allow you to export Crystal Reports to Excel and Word with active formulas, frozen panes, and interactive table filters. This ensures that the exported .XLSX file functions as a dynamic spreadsheet rather than a static snapshot. For businesses that rely on accurate data representation, this functionality can save time and improve decision-making processes.
R-Tag can be particularly useful when you need to export Crystal Reports to Excel and Word 2016 and above. Unlike the direct Crystal Reports export to Excel, which will only export flat, unformatted data, R-Tag is able to export reports to Excel with formatting, charts, pictures, and more. This allows users to create visually appealing reports that can be easily shared and manipulated within Excel.
There are 2 options available for exporting:
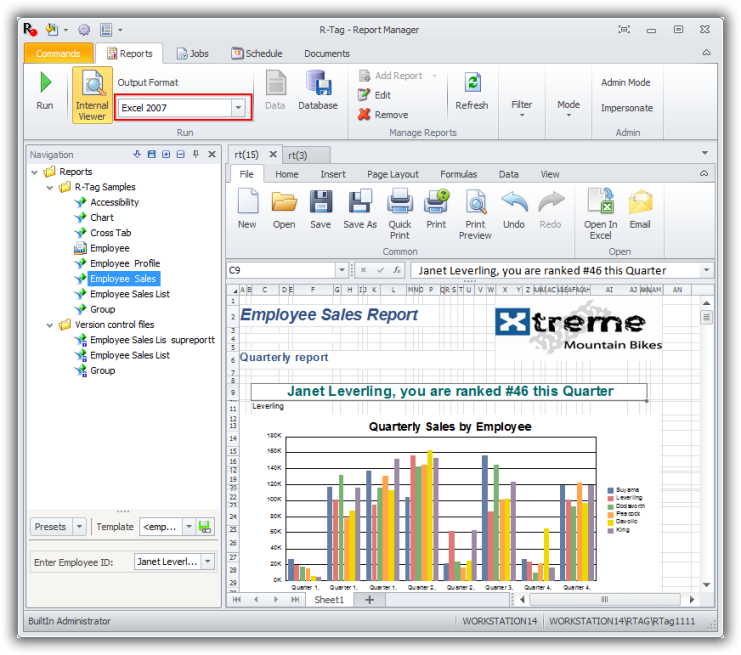
1. Direct Export to Excel 2007-2022 from the “Output Format” Combo Box
The choice between direct export and R-Tag extensions comes down to the requirements of your analysis. If you are presenting data that requires real-time interaction and editing, R-Tag’s features are invaluable.
2. Export to Excel 2007-2025 table through R-Tag Crystal extensions
Understanding the Importance of Choosing the Right Export Method
When exporting reports, choosing the correct method can greatly affect the usability of the data. For instance, using R-Tag not only enhances the appearance but also increases the functionality of the exported report, making it easier for users to work with complex datasets.
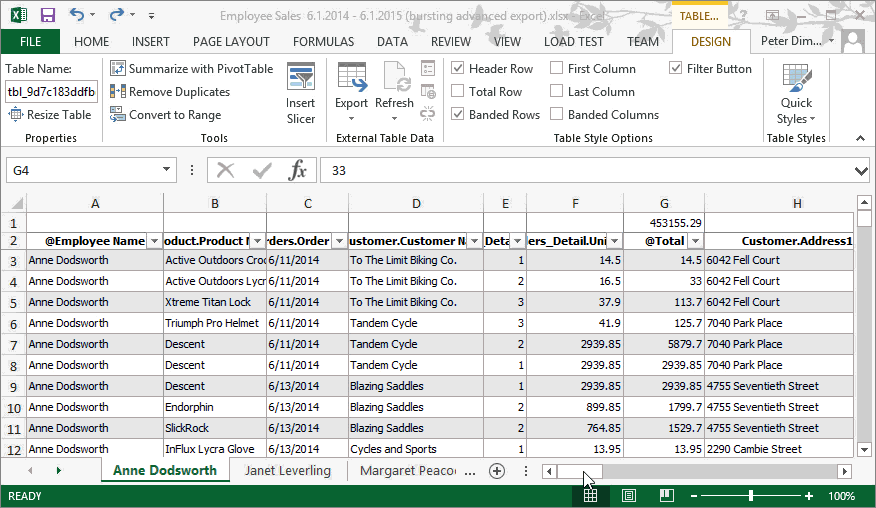
Additionally, users can customize these summaries to reflect various calculations, including SUM, COUNT, MIN, MAX, and AVG, depending on what insights they wish to extract from the data. This flexibility is critical for producing tailored reports that meet specific business needs.
It is essential to understand the various export settings available and how they can impact the final report. Exploring options such as conditional formatting and custom table styles can elevate the quality of the final output, leading to more persuasive presentations.
Ultimately, the ability to export Crystal Reports to Excel and Word effectively can empower users and teams to make informed decisions that drive business success.
Why You Should Export Crystal Reports to Excel and Word
Exporting Crystal Reports to Excel and Word is not just about transferring data; it’s about enhancing the accessibility and usability of your reports. By leveraging advanced exporting tools like R-Tag, you can ensure that your data remains dynamic, interactive, and visually appealing. Whether for internal use or client presentations, investing in the right export methods can lead to significant improvements in how information is conveyed and understood.
The first export is very similar to the regular export from Crystal Reports to Excel, with the file format being .XLSX. It supports gridlines (on/off), pictures, and conditional formatting. Utilizing these features can enhance the readability of reports and help emphasize key data points.
The second export utilizes R-Tag extensions to create a .XLSX file with table styles, formulas, summaries, filters, and frozen panes. In the example above, summaries are set at the top of the file with column captions and filters applied to enhance data analysis capabilities.
The first 2 rows are frozen and will be always visible, so when you scroll to the bottom of the table you will still see the summaries and captions at the top. When a filter is applied, the number of visible rows will change and the summary values will change (summaries are saved as formulas). Summaries can be set to SUM, COUNT, MIN, MAX, AVG, etc.
The configuration of the export is performed through R-Tag export settings. The user is empowered to customize everything: table styles, formulas, summaries, and the position of the summaries (they can be placed at the bottom of the table as well). This level of customization allows for better presentation and comprehension of data.
Want more info? Please visit our website at www.r-tag.com, or our blog homepage www.blog.reporttag.com.
Originally posted on Oct 9 2016